介绍
vue3-highcharts是一个针对Vue3框架设计并包装highcharts.js的Vue组件包,目的是为了更加方便的在Vue3中使用highcharts,使用Vue3的组合式API进行图表开发。


Github
https://github.com/smithalan92/vue3-highcharts
安装使用
- 依赖包安装
npm i --save vue3-highcharts

或者使用你喜欢的包管理工具进行安装 比如

yarn add vue3-highcharts- 组件注册
分为全局注册和按需注册
//全局注册
import { createApp } from 'vue';
import VueHighcharts from 'vue3-highcharts';

const app = createApp(..options);
app.use(VueHighcharts);
//按需注册
import VueHighcharts from 'vue3-highcharts';
export default {
name: 'MyChart',
components: {
VueHighcharts,
},
};推荐使用按需注册以减少打包后的文件体积
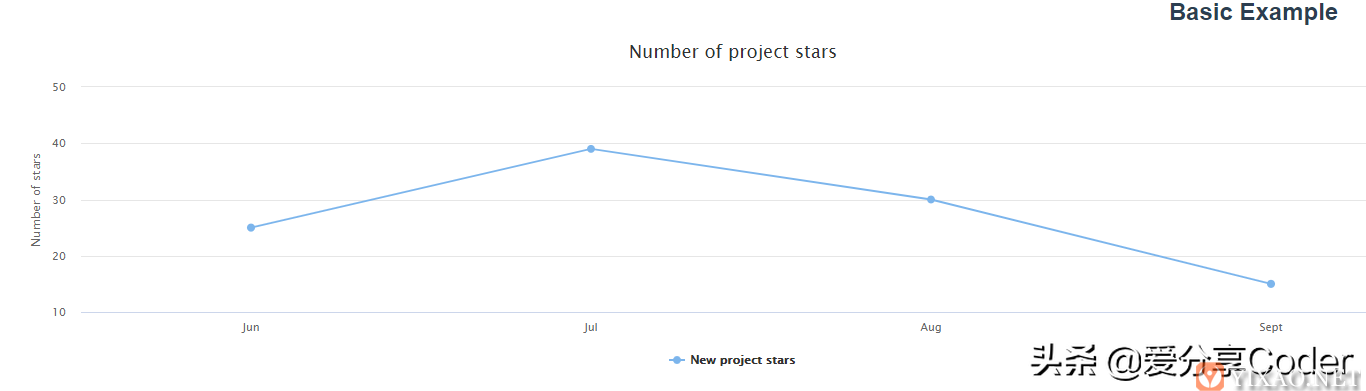
- 简单的示例
<template>
  <vue-highcharts
    type="chart"
    :options="chartOptions"
    :redrawOnUpdate="true"
    :oneToOneUpdate="false"
    :animateOnUpdate="true"
    @rendered="onRender"/>
</template>
<script>
  import VueHighcharts from 'vue3-highcharts';

  export default {
    name: 'SimpleChart',

    components: {
      VueHighcharts,
    },

    setup() {
      const seriesData = ref([25, 39, 30, 15]);
      const categories = ref(['Jun', 'Jul', 'Aug', 'Sept']);

      const chartOptions = computed(() => ({
        chart: {
          type: 'line',
        },
        title: {
          text: 'Number of project stars',
        },
        xAxis: {
          categories: categories.value,
        },
        yAxis: {
          title: {
            text: 'Number of stars',
          },
        },
        series: [{
          name: 'New project stars',
          data: seriesData.value,
        }],
      }));

      const onRender = () => {
        console.log('Chart rendered');
      };

      return {
        chartOptions,
        onRender,
      };
    },
  };
</script>
这是最简单的一个折线图
- 股票图表示例
<template>
  <vue-highcharts
    type="stockChart"
    :options="chartOptions"
    :redrawOnUpdate="true"
    :oneToOneUpdate="false"
    :animateOnUpdate="true"
    @updated="onUpdated"/>
</template>
<script>
  import VueHighcharts from 'vue3-highcharts';
  import HighCharts from 'highcharts';
  import StockCharts from 'highcharts/modules/stock';

  StockCharts(HighCharts);

  export default {
    name: 'StockChart',

    components: {
      VueHighcharts,
    },

    setup() {
      const chartOptions = {
        rangeSelector: {
          selected: 1,
        },

        title: {
          text: 'Stock Prices',
        },
        series: [
          {
            name: 'MyStock',
            data: [
              [1537795800000, 55.2],
              [1537882200000, 55.55],
              [1537968600000, 55.1],
              [1538055000000, 56.24],
              [1538141400000, 56.44],
              [1538400600000, 56.81],
              [1538487000000, 57.32],
              [1538573400000, 58.02],
              [1538659800000, 57]],
          },
        ],
      };

      return {
        chartOptions,
        codeSample,
      };
    },
  };
</script>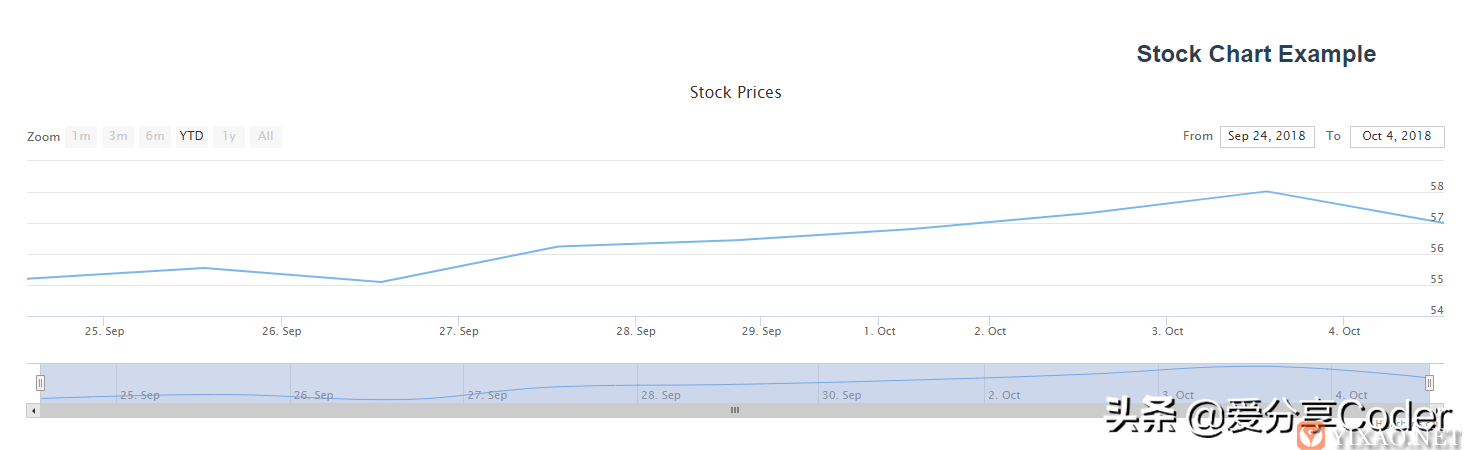
极坐标图示例:
<template>
  <vue-highcharts
    type="chart"
    :options="chartOptions"
    :redrawOnUpdate="true"
    :oneToOneUpdate="false"
    :animateOnUpdate="true"/>
</template>
<script>
import VueHighcharts from 'vue3-highcharts';
import HighCharts from 'highcharts';
import HighchartsMore from 'highcharts/highcharts-more';

HighchartsMore(HighCharts);

export default {
  name: 'PolarChart',

  components: {
    VueHighcharts,
    CodeBlock,
  },

  setup() {
    const chartOptions = {
      chart: {
        polar: true,
      },
      title: {
        text: 'Highcharts Polar Chart',
      },
      pane: {
        startAngle: 0,
        endAngle: 360,
      },
      xAxis: {
        tickInterval: 45,
        min: 0,
        max: 360,
        labels: {
          format: '{value}°',
        },
      },
      yAxis: {
        min: 0,
      },
      plotOptions: {
        series: {
          pointStart: 0,
          pointInterval: 45,
        },
        column: {
          pointPadding: 0,
          groupPadding: 0,
        },
      },
      series: [{
        type: 'column',
        name: 'Column',
        data: [8, 7, 6, 5, 4, 3, 2, 1],
        pointPlacement: 'between',
      }, {
        type: 'line',
        name: 'Line',
        data: [1, 2, 3, 4, 5, 6, 7, 8],
      }, {
        type: 'area',
        name: 'Area',
        data: [1, 8, 2, 7, 3, 6, 4, 5],
      }],
    };

    return {
      chartOptions,
      codeSample,
    };
  },
};
</script>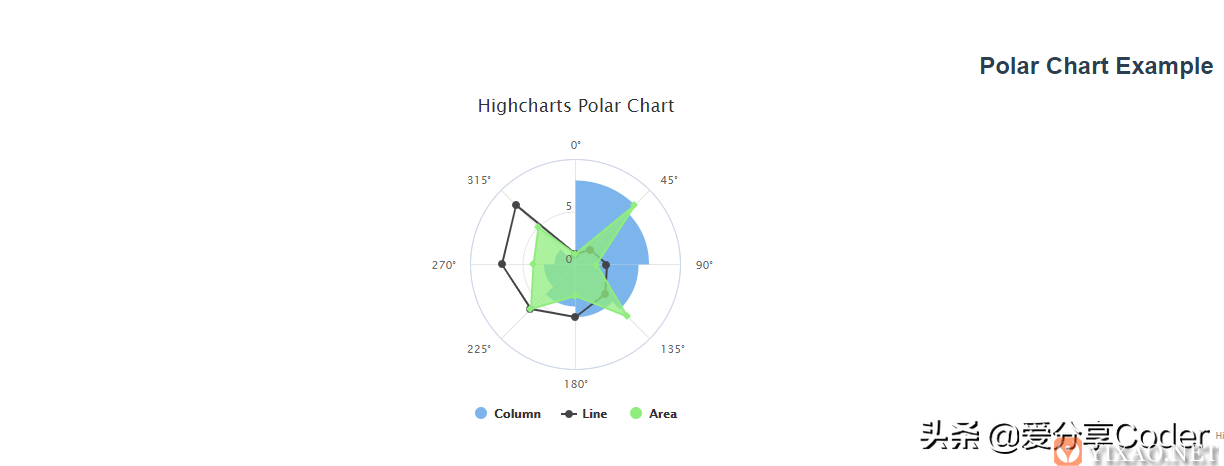
总结
本文只是简单地介绍几个例子,实际上更多的功能需要自身去挖掘,vue3-highcharts也只是对highcharts进行了一层包装,更多功能还得看highcharts本身!
内容出处:,
声明:本网站所收集的部分公开资料来源于互联网,转载的目的在于传递更多信息及用于网络分享,并不代表本站赞同其观点和对其真实性负责,也不构成任何其他建议。如果您发现网站上有侵犯您的知识产权的作品,请与我们取得联系,我们会及时修改或删除。文章链接:http://www.yixao.com/share/26677.html
 微信扫一扫
微信扫一扫
 支付宝扫一扫
相关推荐
-
20个很有用的CSS图形和图表分享
图形和图表主要用于以如饼图、折线图、条形图等方式展示数值数据的直观形式。有众多的技术利用CSS3来创建不同的图表。在任何Web行业,一个良好和优秀的数据演示可以让客户直观了解你分析…
-
推荐三个资源网站,打开你设计新世界的大门
今天小编为大家推荐三个网站,打开你新世界大门!在网络上找资源是一件麻烦事,找到自己想要的资源也是一种能力。这三个网站那可是宝藏级别的,点开看一看,我相信对于渴望新知的你一定流连忘返…
-
做知识付费必备的7个工具与解决方案,哪一个是你现在正在使用的
近年来,知识付费成为一种主流,随着知识付费的逐渐演化,现在的各种解决方案与工具已经非常丰富了,也花样繁多,总有一款适合你的解决方案。一般来说,做内容付费的用户多为自媒体人、社群达人…
-
Vant–有赞出品的前端组件库
有赞前端团队在开源领域算是比较活跃的团队了,而他们的开源项目也都非常优秀,今天 Gitee 分享的这款就是由有赞前端团队维护了四年的移动端前端组件库 Vant。 项目名称:Vant…
-
Cleave.js–Web表单开发之实时格式化显示
介绍 Cleave.js是一个帮助表单实现各种复杂实时格式化显示的工具库,可以说Cleave.js让表单的输入变得更加的高逼格,能实现很多复杂的表单格式化显示,简而言之就是针对标签…
-
Vue.js 3.0的Suspense组件简介
Suspense组件是Vue3中的知名功能之一。 它们允许我们的应用程序在等待异步组件时渲染一些后备内容,可以让我们创建一个平滑的用户体验。 值得庆幸的是,Suspense组件非常…
-
如何使用PyMeta搜索和提取目标域名相关的元数据
关于PyMeta PyMeta是一款针对目标域名元数据的信息收集工具,该工具基于Python 3开发,是PowerMeta(基于PowerShell开发)的Python 3重构版本…
-
Mall:用SpringBoot实现一个电商系统
目前最为主流的 Web 开发技术,包括 SpringBoot、MyBatis、MongoDB、Kibina、Docker、Vue 等,都是开发者十分需要掌握的技术。有没有一个全面而…
-
Scherlokk for Mac(文件搜索软件) v4.4(44001)免激活版
内容介绍 Scherlokk是一款macOS平台的强大的文件搜索查找工具,可以帮助我们快速地查找到指定的文件,无论是本地硬盘或者是外接的存储设备,都能把自己需要的文件高效地查找出来…
-
BAT都在使用的开源接口管理平台
介绍 给大家推荐一个开源接口管理平台YApi,众多互联网大厂都在使用 YApi 的一些客户:百度,阿里巴巴,腾讯,今日头条等 GitHub地址:https://github.com…